Use the support resistance indicator on MetaTrader4 (MT4) to mark the recentswing highs and lows in price. This, in turn, can help identify the trend and spot potential reversals. Use the indicator as a trend confirmation and analysis tool.
Support and resistance are more than just lines drawn at price highs and lows on a chart. Support and resistance levels on a price chart are dynamic and may be horizontal, sloped, or projected. While drawing lines at recent highs and lows is one of the most basic forms of support and resistance, some new traders like to see the recent highs and lows marked on their charts. Having this gives a more pronounced picture of whether the price is rising or falling.
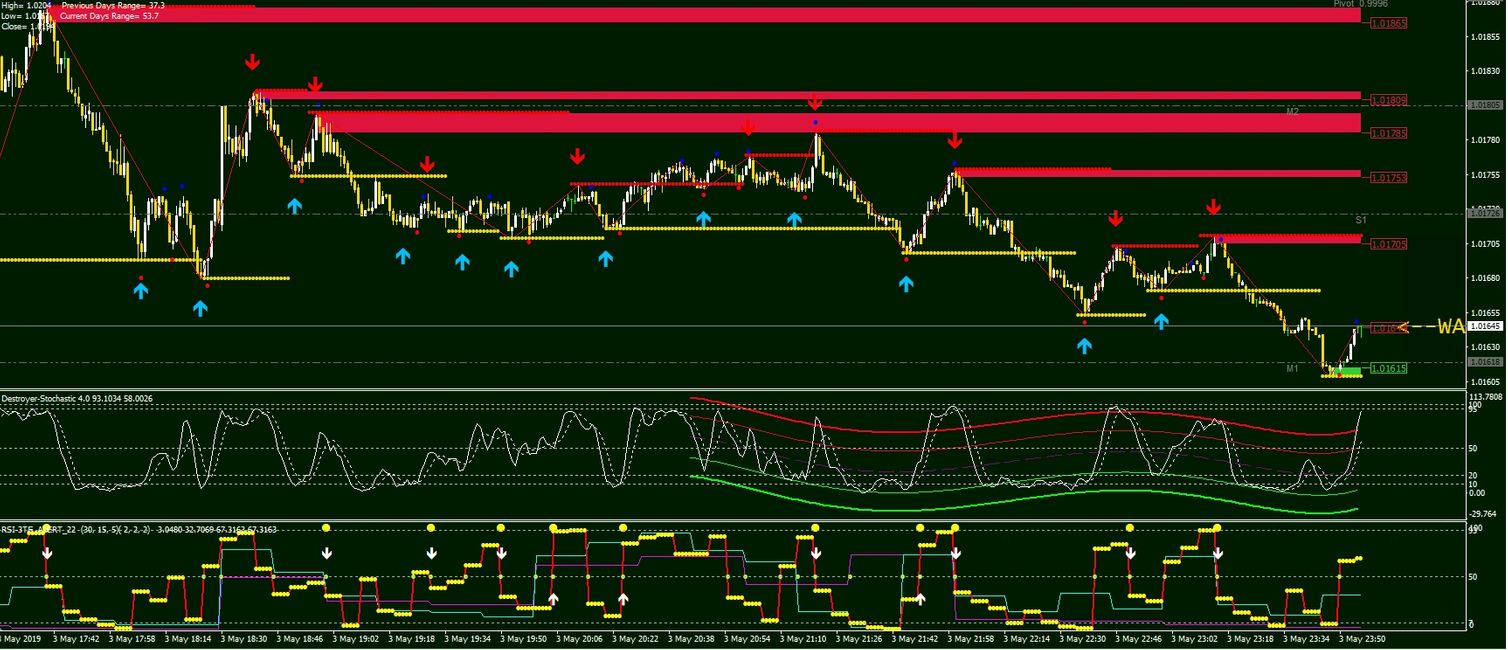
The indicator draws horizontal lines at recent swing highs and swing lows. During an uptrend, the horizontal lines along both the swing highs and lows move up. When that no longer holds true, the uptrend may be reversing to the downside. For a downtrend, the horizontal lines will be dropping. When they start to rise, the uptrend may be over and an uptrend may be starting.
This indicator draws dots along recent high points and low points. The lines extend out to the right until another new high or low forms, then a new line is drawn.
On the EUR-USD chart above the lines move with the price, forming higher horizontal lines along the highs and lows as the price makes upward progress. This helps spot the trend and also see when the trend is reversing.